On November 11, 2026, ChainCatcher relayed a note from crypto-market research firm 10x Research on average Bitcoin performance after U.S. midterm elections. The percentages below are averages the firm states, as summarized by ChainCatcher. They are not an election result, a forecast, or a verified dataset. The brief does not include which elections were counted, how many cycles sit behind the averages, or the calculation method.
The path 10x Research describes
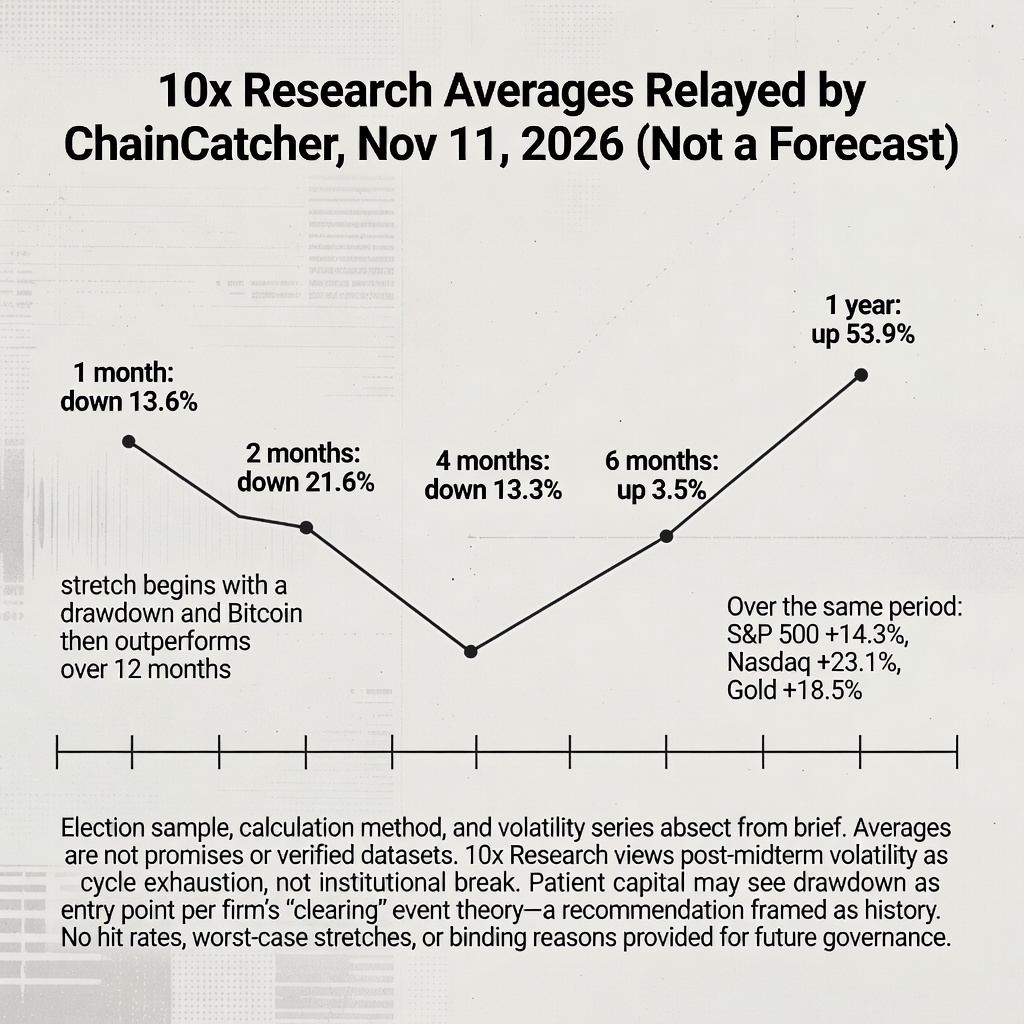
ChainCatcher reports that 10x Research puts average Bitcoin returns after midterms at:
- 1 month: down 13.6%
- 2 months: down 21.6%
- 4 months: down 13.3%
- 6 months: up 3.5%
- 1 year: up 53.9%
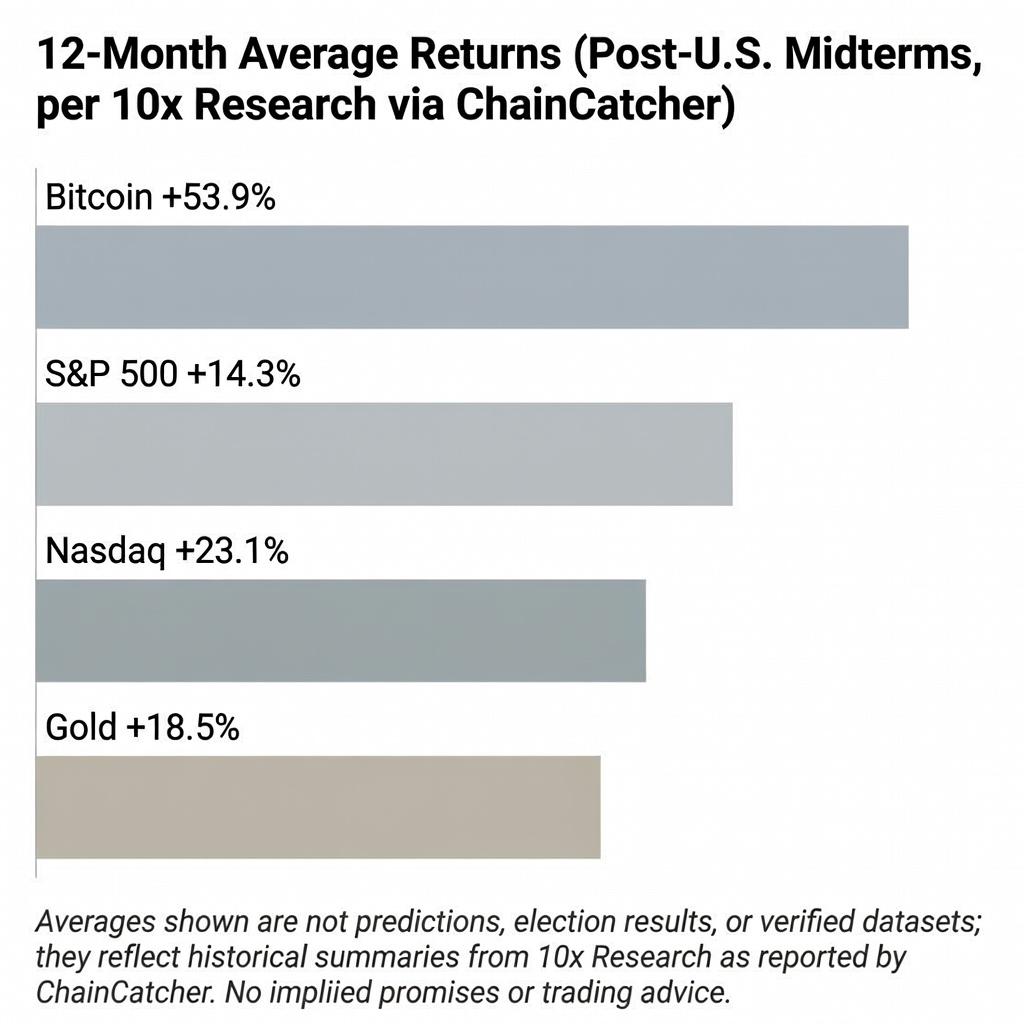
The firm’s account, via ChainCatcher, is that the stretch begins with a drawdown and that Bitcoin then outperforms over 12 months. It says average returns over that same period were up 14.3% for the S&P 500, up 23.1% for the Nasdaq, and up 18.5% for gold.
What the firm treats those averages as meaning
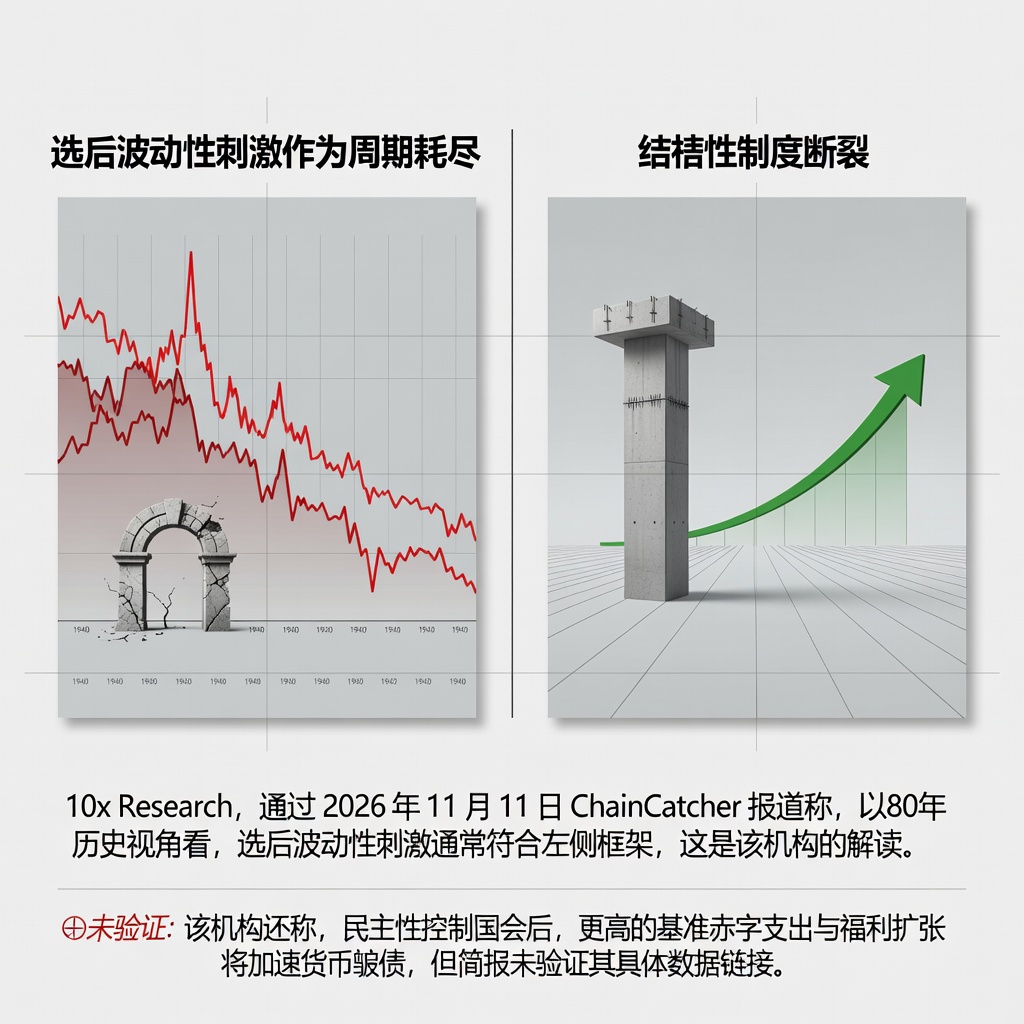
10x Research says that, viewed across 80 years, a post-election jump in volatility has usually marked cycle exhaustion rather than a structural break in institutions. That is the firm’s reading of the history it cites. ChainCatcher’s summary does not show the volatility series or test the “usually.”
The firm also says that after Democrats take control of Congress, higher baseline deficit spending and an expansion of welfare programs would speed currency depreciation. ChainCatcher presents this as 10x Research’s statement. The relayed text does not document a congressional outcome, a deficit figure, or a measured link from that spending to the Bitcoin averages above.
The entry-point argument is theirs
10x Research is described as reviewing earlier post-midterm cycles and explaining why patient capital should treat this drawdown as an entry point. The discussion is built around a post-midterm “clearing” event the firm itself proposes. That is a recommendation dressed as history. A research shop telling readers why the decline is the place to get in has a plain incentive to turn an average into a setup. The summary supplies the percentages and the direction of that advice. It does not supply the hit rate, the worst stretch inside the sample, or any reason a past average should govern the next year.
None of the figures is a promise about what Bitcoin does next, and nothing here is a case for buying or selling.
Original report: ChainCatcher, published November 11, 2026, 22:18 (UTC+8).